

Ginkgo X Phylo: Biomni Democratizes Rapid Interpretation of Complex Transcriptomic and Cell Painting Data
Ginkgo Datapoints partnered with Phylo’s Biomni Lab platform to explore what happens when high-quality functional genomics datasets, like our GDPx series, meet natural language-powered AI analysis. What once took weeks of manual bioinformatics with multiple scientific specialists, Biomni Lab completed in just hours. It was able to interpret complex transcriptomic and Cell Painting data and generate publication-ready insights and data visualizations. Read more about our results.
Ginkgo Datasets
At Ginkgo Bioworks, we're breaking down barriers to generate and use data effectively, accelerating research and advancing scientific discovery. We've open-sourced a series of functional genomics datasets designed to democratize access to high quality data: GDPx1 + GDPx2 (chemical perturbations in primary cells profiled with Drug-seq) and GDPx3 (chemical perturbations in primary cells profiled with Cell Painting). These resources provide researchers with high-quality perturbation data needed to drive meaningful insights in biomedical research.
These datasets contain a plethora of insights about cells across diverse conditions including: cell types, treatments and doses. Each condition yields thousands of measurements from transcriptomics and high-content imaging, however most of the insights remain buried. This is because traditional analysis approaches have significant bottlenecks:
Coordination complexity: Multiple specialists across bioinformatics, cell biology, and pharmacology must work together to finish the task.
Time bottlenecks: Teams spend weeks to months on manual data processing, bioinformatics analysis, visualization, and hypothesis testing.
The result? Potential discoveries remain locked in data, while scientists wait for computational resources and expertise to become available.
Biomni Lab by Phylo - A Virtual Lab for Every Biologist
Biomni Lab (biomni.phylo.bio) is a virtual lab where biologists can delegate day-to-day research tasks, such as complex data analysis, to an AI agent through natural language queries. Developed by researchers at Stanford and collaborating institutions and now spun out as a startup under the name Phylo, Biomni Lab enables data interpretation and visualization in minutes for tasks that traditionally take days or weeks. In order to demonstrate Biomni’s capabilities, we queried Biomni with Ginkgo’s transcriptomic and cell painting datasets.
GDPx2 DRUG-seq Analysis
We asked Biomni to analyze disease signatures across 89 compounds from our GDPx2 DRUG-seq dataset. This comprehensive transcriptomic profiling dataset contains 85 pharmacologically active compounds tested across multiple concentrations in primary human cell types- Aortic Smooth Muscle Cells, Dermal Fibroblasts, Skeletal Muscle and Epithelial Melanocytes.
We generated two categories of prompts:
-
Starting from the raw counts data and metadata, we first aimed to reproduce and visualize results we had obtained from our own bioinformatics analysis as shown in our BioRxiv preprint. Using the GDPx2 raw counts, we were able to re-generate Figures 2 a,b,c and Supplementary Figure 2 in the pre-print by specifying the analysis tool and associated parameters. We are not showing those results here.
-
For more complex analyses—including differential expression, pathway enrichment, and dose-response modeling, we bypassed primary bioinformatic computation within Biomni, utilizing the platform instead for the interpretation and visualization of pre-processed results. By providing Biomni with raw counts, metadata, and precomputed datasets (DE, GSEA, and dose-response), we enabled a rapid synthesis of complex information. This approach proved highly effective for identifying key patterns and served as a robust environment for validating specific hypotheses grounded in our primary data.
Some examples of prompts are listed below:
Question 1: Using the DoseResponse.csv in the datalake for GDPx2, plot a ranked list
showing the number of dose-dependent genes split by cell type and compound.
The number of dose-dependent genes observed by cell type match our expectations, as described in our BioRxiv preprint, with the highest number of dose-dependent genes attributed to our controls trichostatin A and brefeldin A.
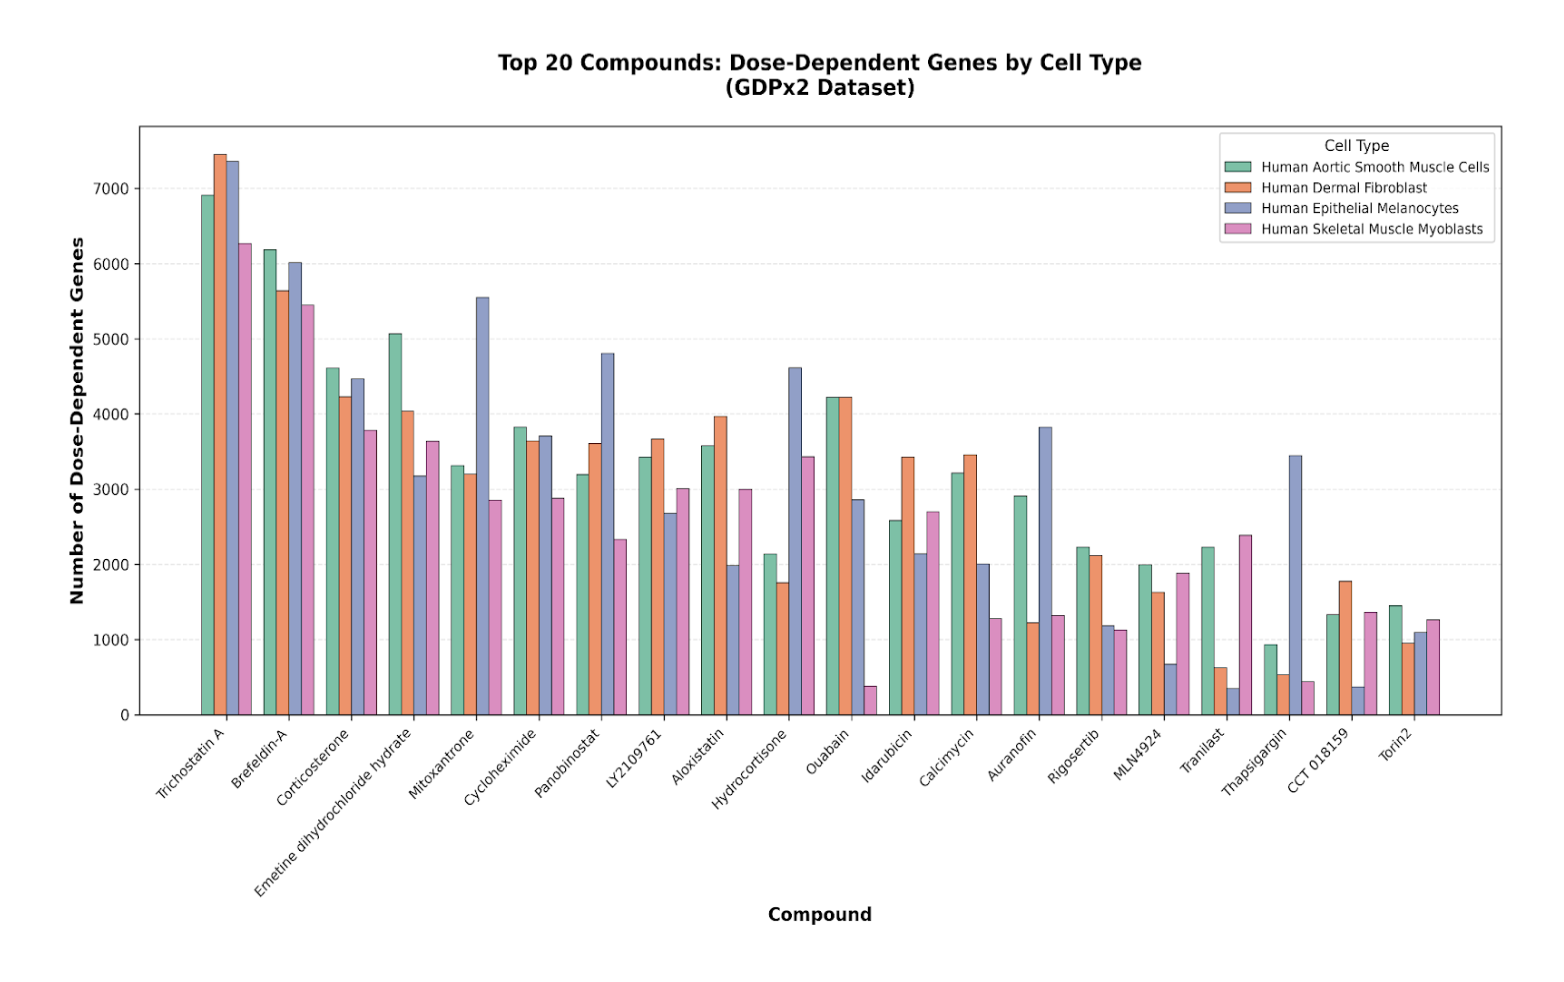
Figure 1. Dose-dependent gene numbers of top 20 compounds by cell type.
Question 2: Using the DoseResponse.csv in the datalake for GDPx2, which cell types have
the highest number of dose-dependent genes in response to the known HDAC inhibitors
trichostatin A and panobinostat?
In line with our expectations, Epithelial Melanocytes have the strongest response to HDAC inhibitors in addition to having the highest number of common genes.
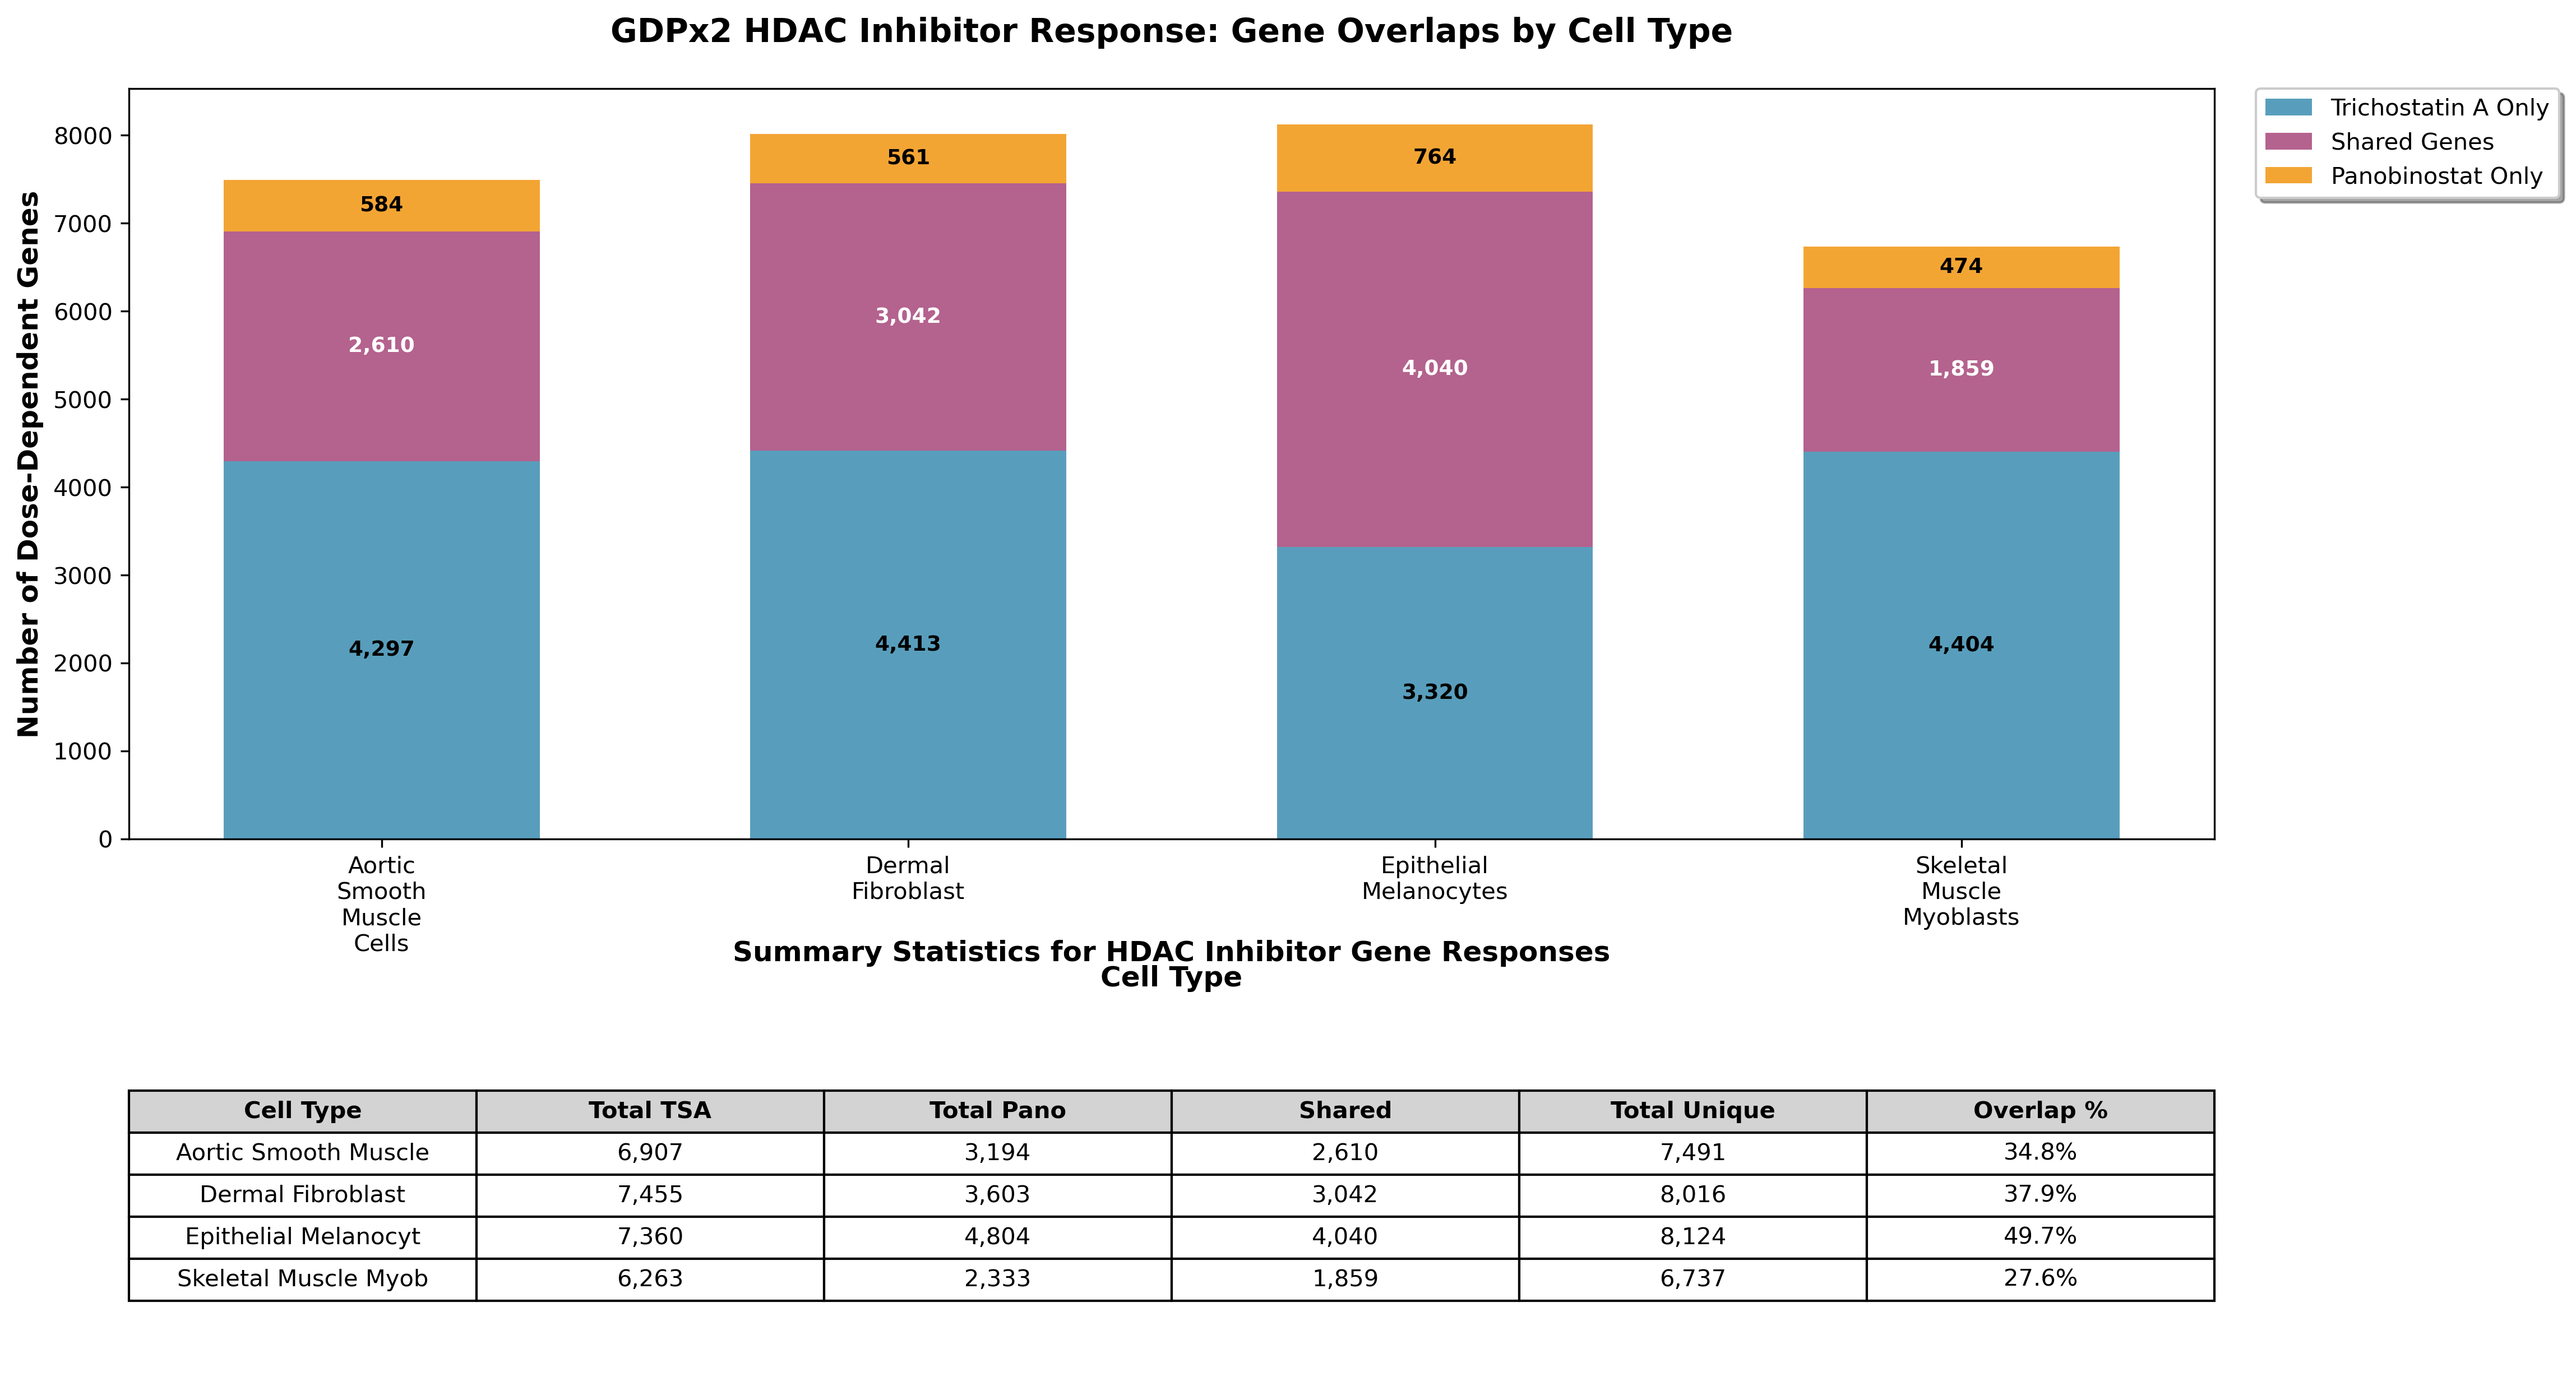
Figure 2. HDAC inhibitor dose-dependent gene response across cell types.
Question 3: Using the DoseResponse.csv in the datalake for GDPx2, which cell type is
most responsive to dexamethasone? Which cell type is most responsive to
dexamethasone - show the number of DEGs and mean(abs(log2FC))?
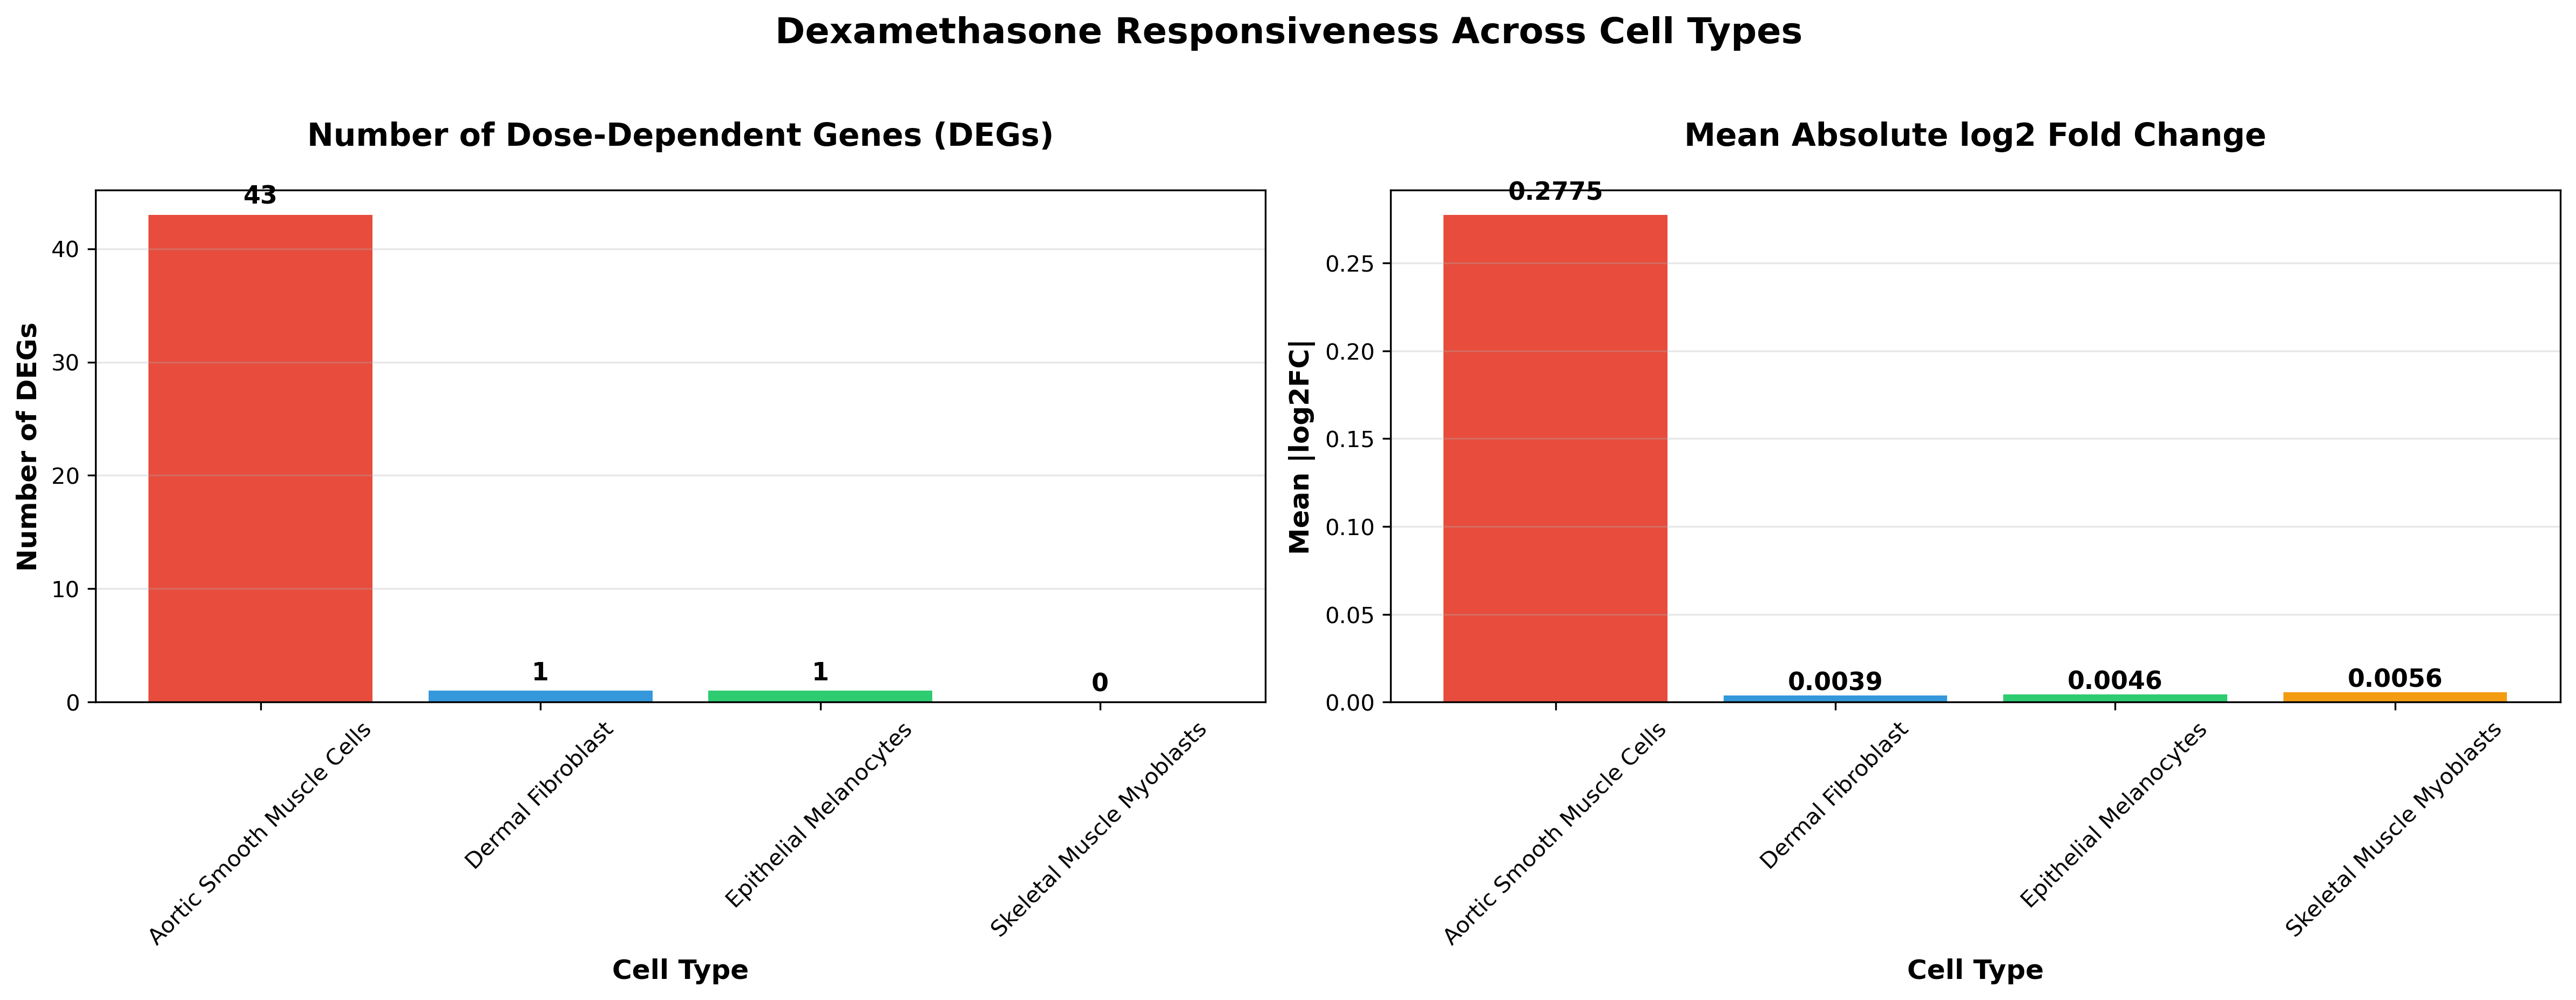
Figure 3. Dexamethasone cell type specific responses.
As we expected, the Aortic Smooth Muscle cells have the highest number of dose-dependent genes in response to dexamethasone and other glucocorticoid targeting drugs.
Question 4: Using the GDPx2_GSEA-HallmarkGenes.csv in the datalake for GDPx2, which
pathways do glucocorticoid drugs activate or inhibit in Aortic Smooth Muscle cells?
Include mean pathway effects across all glucocorticoid drugs.
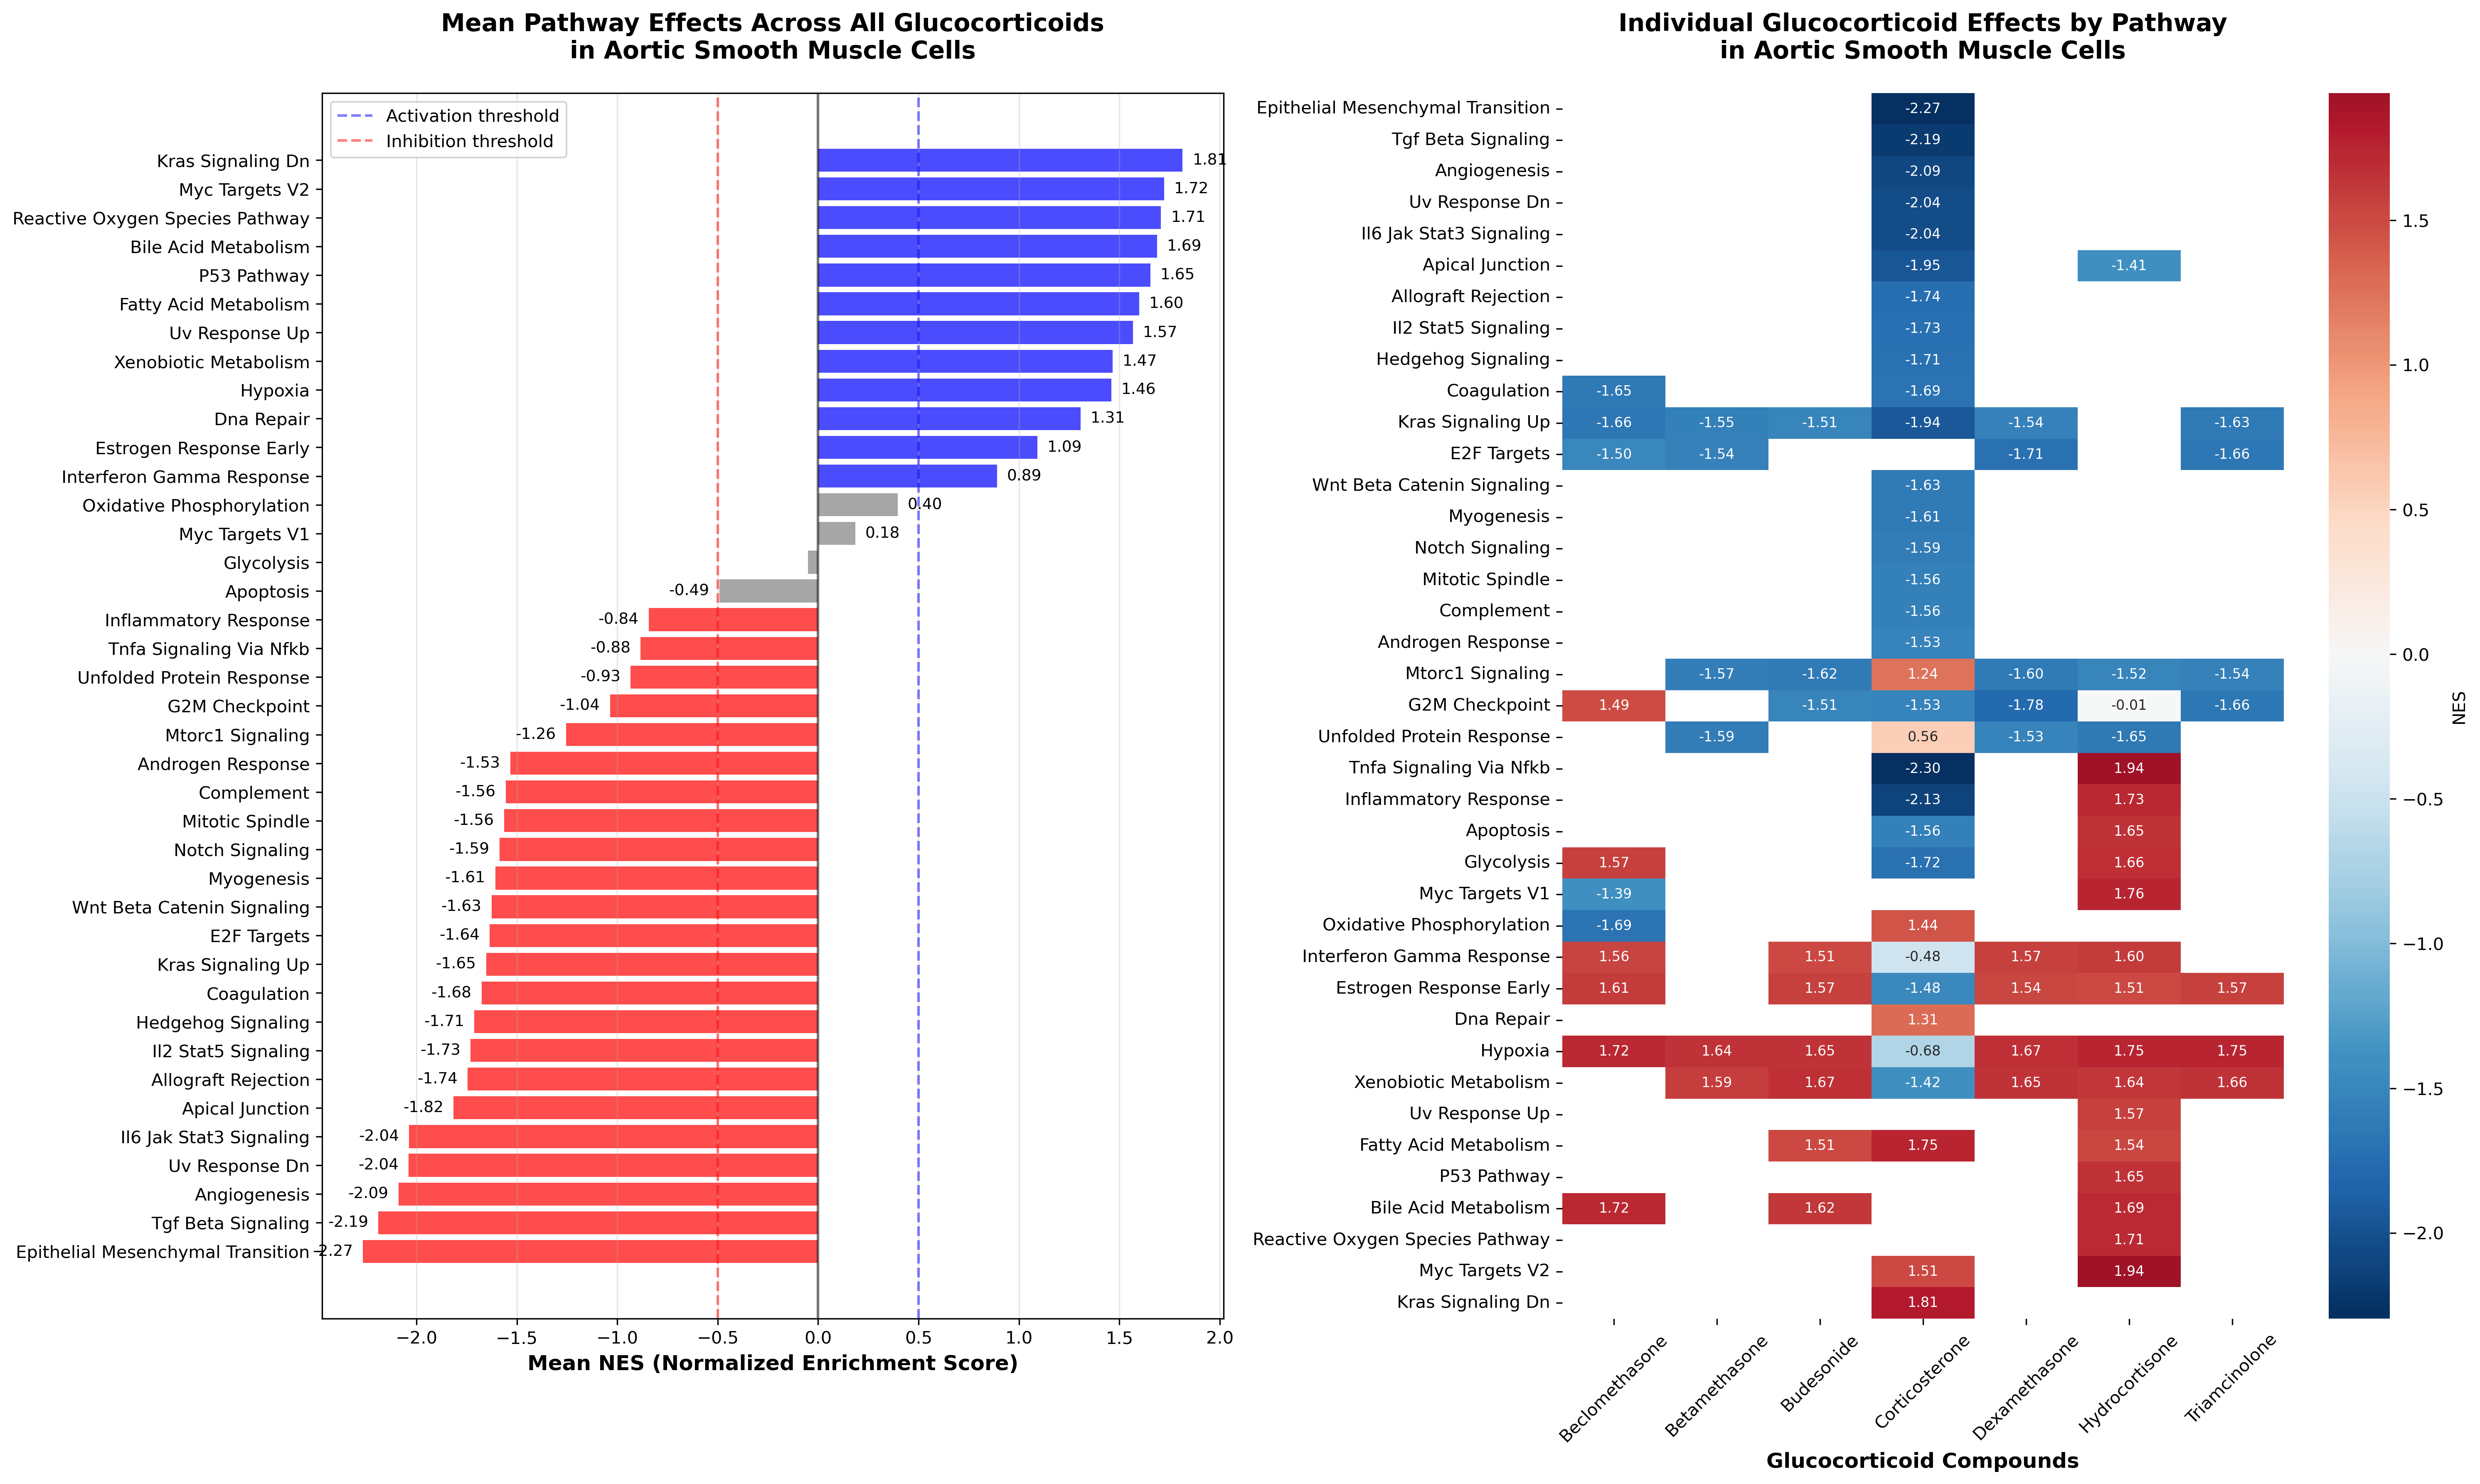
Figure 4. MSigDB pathway enrichment for glucocorticoid targeting drugs.
As expected, glucocorticoid-targeting drugs enriched hypoxia and xenobiotic metabolism pathways. Additionally, corticosterone stood out by driving a broader suppression of pathway activity across the transcriptome.
Question 5: Using the GDPx2_GSEA-HallmarkGenes.csv in the datalake, list the pathways
that are related to cell-killing and identify compounds which lead to common
cell-killing across all cell types and in at least 3 concentrations. Calculate the
mean NES across the 3 concentration with the highest significant NES averaged across
the four cell types.
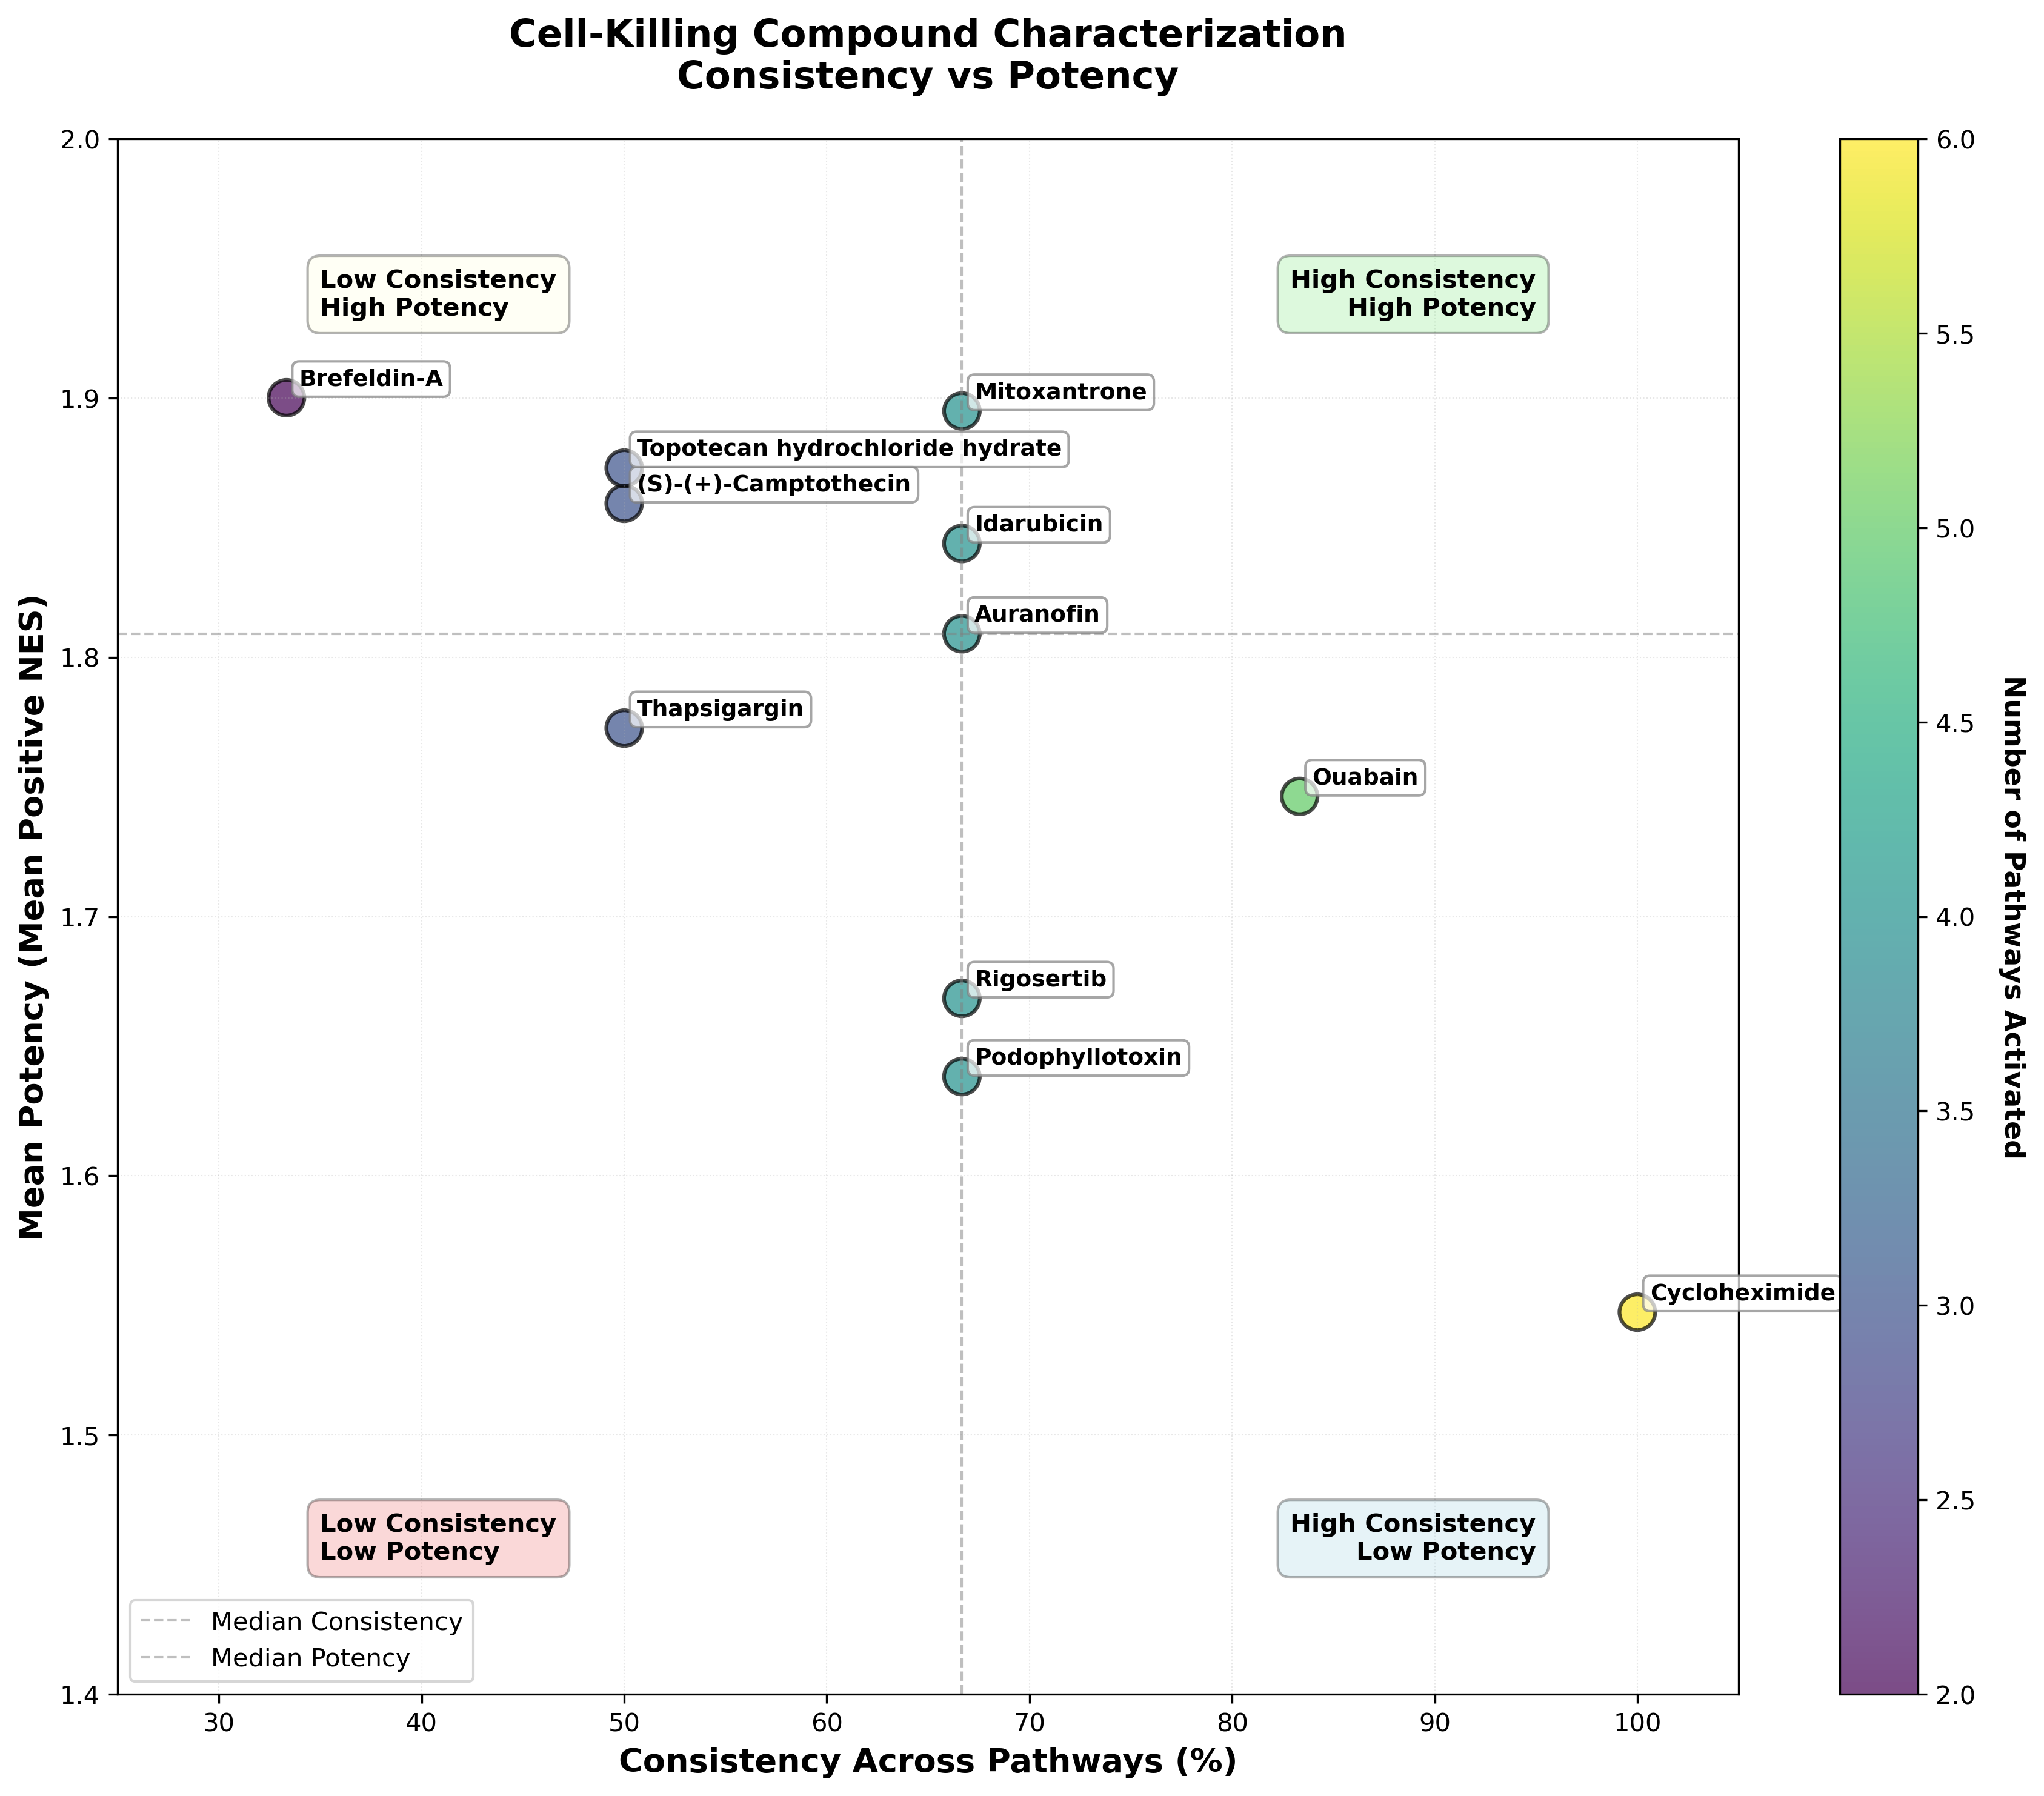
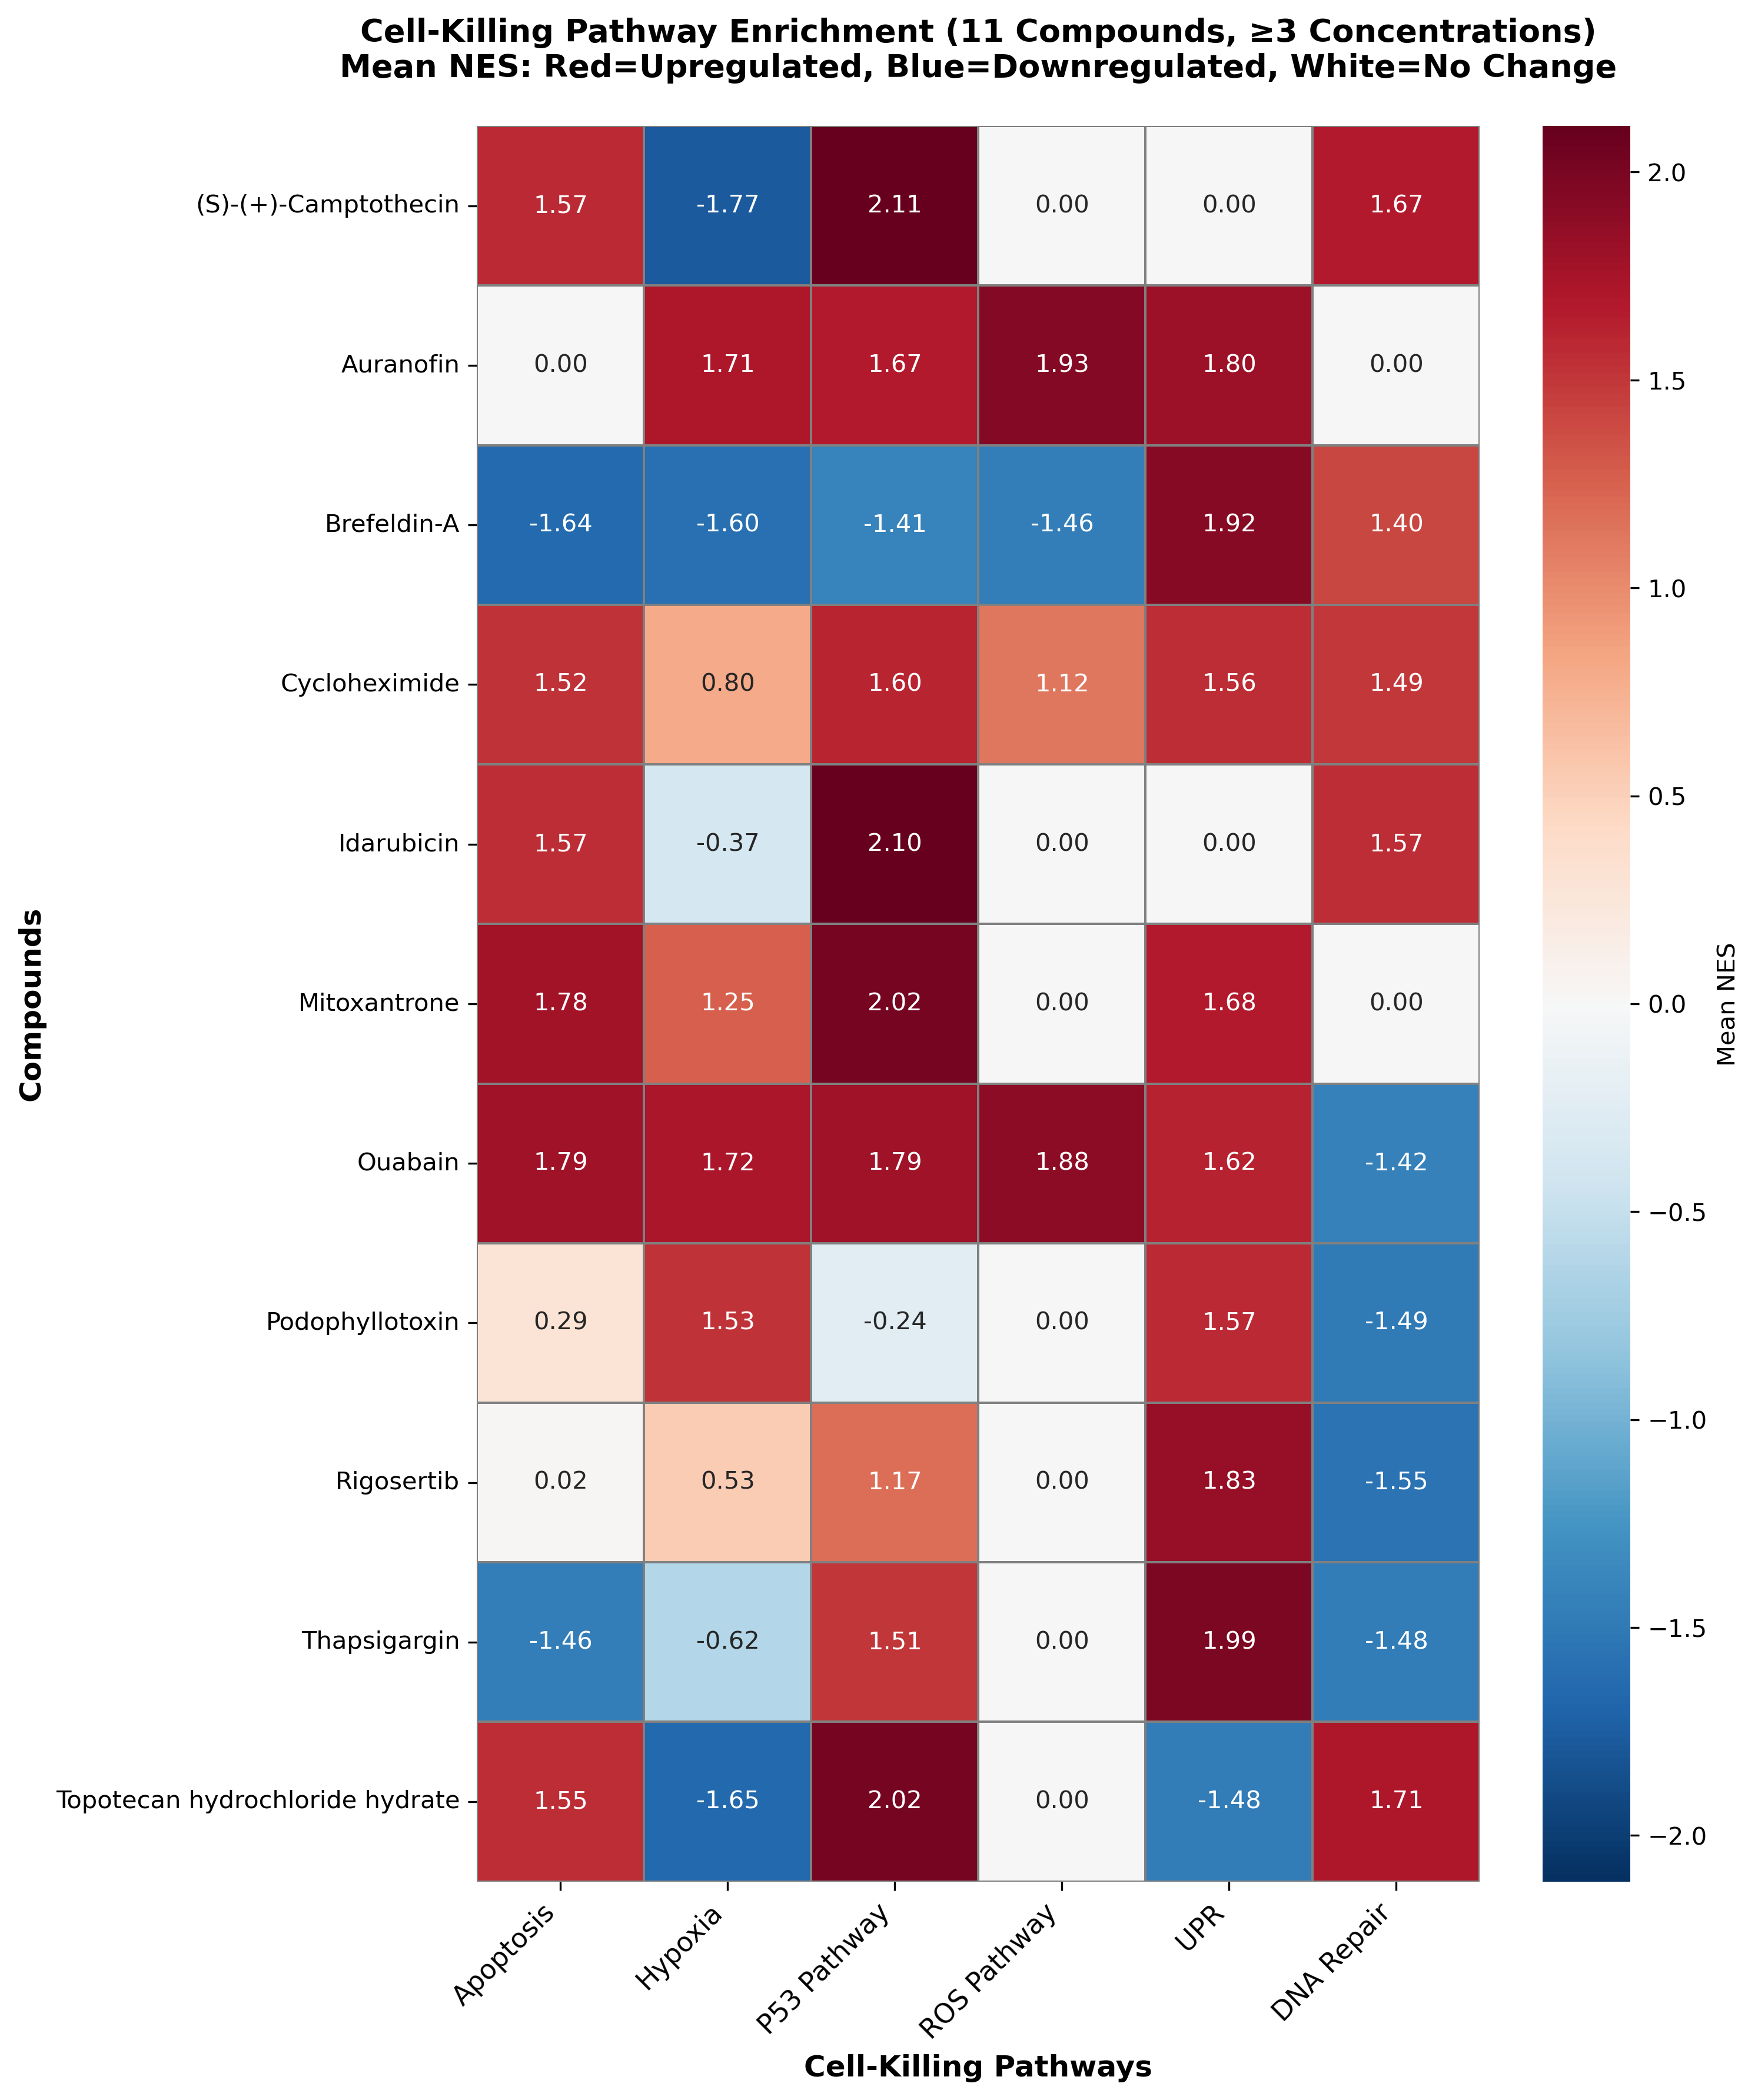
Figure 5. (A) Scatterplot of cross-pathway NES vs Mean NES scores. (B) Drugs with common cell-killing mechanisms across cell types.
To compare cell-killing responses across compounds, we quantified both consistency and potency using GSEA Hallmark pathway enrichment. Consistency captured how broadly cell-killing related pathways were enriched, defined as the fraction of six pathways with positive NES, while potency reflected the strength of the response, measured as the mean NES across the three most significantly enriched concentrations and averaged across the four cell types. Using this framework, cycloheximide emerged as the most consistent compound, enriching all six pathways, followed by ouabain, which enriched five. Other compounds showed more moderate breadth. In contrast, potency highlighted a different set of compounds: brefeldin A, mitoxantrone, and topotecan exhibited the strongest enrichment signals, indicating high-intensity but not necessarily broad cell-killing effects.
Applying this analysis, Biomni identified 11 compounds that consistently activated cell-killing pathways across all four primary human cell types - Aortic Smooth Muscle cells, Dermal Fibroblasts, Skeletal Muscle and Epithelial Melanocytes - at three or more concentrations. Biomni rapidly synthesized these results, generating comparative visualizations that made it easy to assess both shared cytotoxic signatures and pathway level differences across cell types.
GDPx3 Cell Painting Analysis
Similarly, we asked Biomni to analyze morphological features from a Cell Painting dataset of 45 pharmacologically active compounds tested across four cell types: A549 cells plus three primary human cell types (Aortic Smooth Muscle cells, Dermal Fibroblasts, and Aortic Endothelial cells). We tasked Biomni with a step-by-step QC of the provided data structures and with generating comprehensive summaries and visualizations of the CellProfiler-extracted morphological features.
Example prompts are listed below:
Question 6: “I am analyzing data from a chemical perturbation dose response screen
with a Cell Painting readout performed in 4 cell types. I have feature data
described in GDPx3_median_selected.csv, metadata in GDPx3_metadata.csv, and
metadata column information in Ginkgo GDPx3_metadata_columns.csv.

For each cell type, z-score transform the columns in GDPx3_median_selected.csv
values.  For each cell type, generate a plot for the top 20 PC’s for variance
explained by timepoint, concentration, compound, and container_id.

On a separate plot, generate a principal component analysis of the features and
plot PC1 vs PC2 with timepoints (24 and 48 hrs) colored in one set of plots and
colored by sample type in another set of plots. Include a UMAP visualization using
the top 20 PCs colored by sample type.”
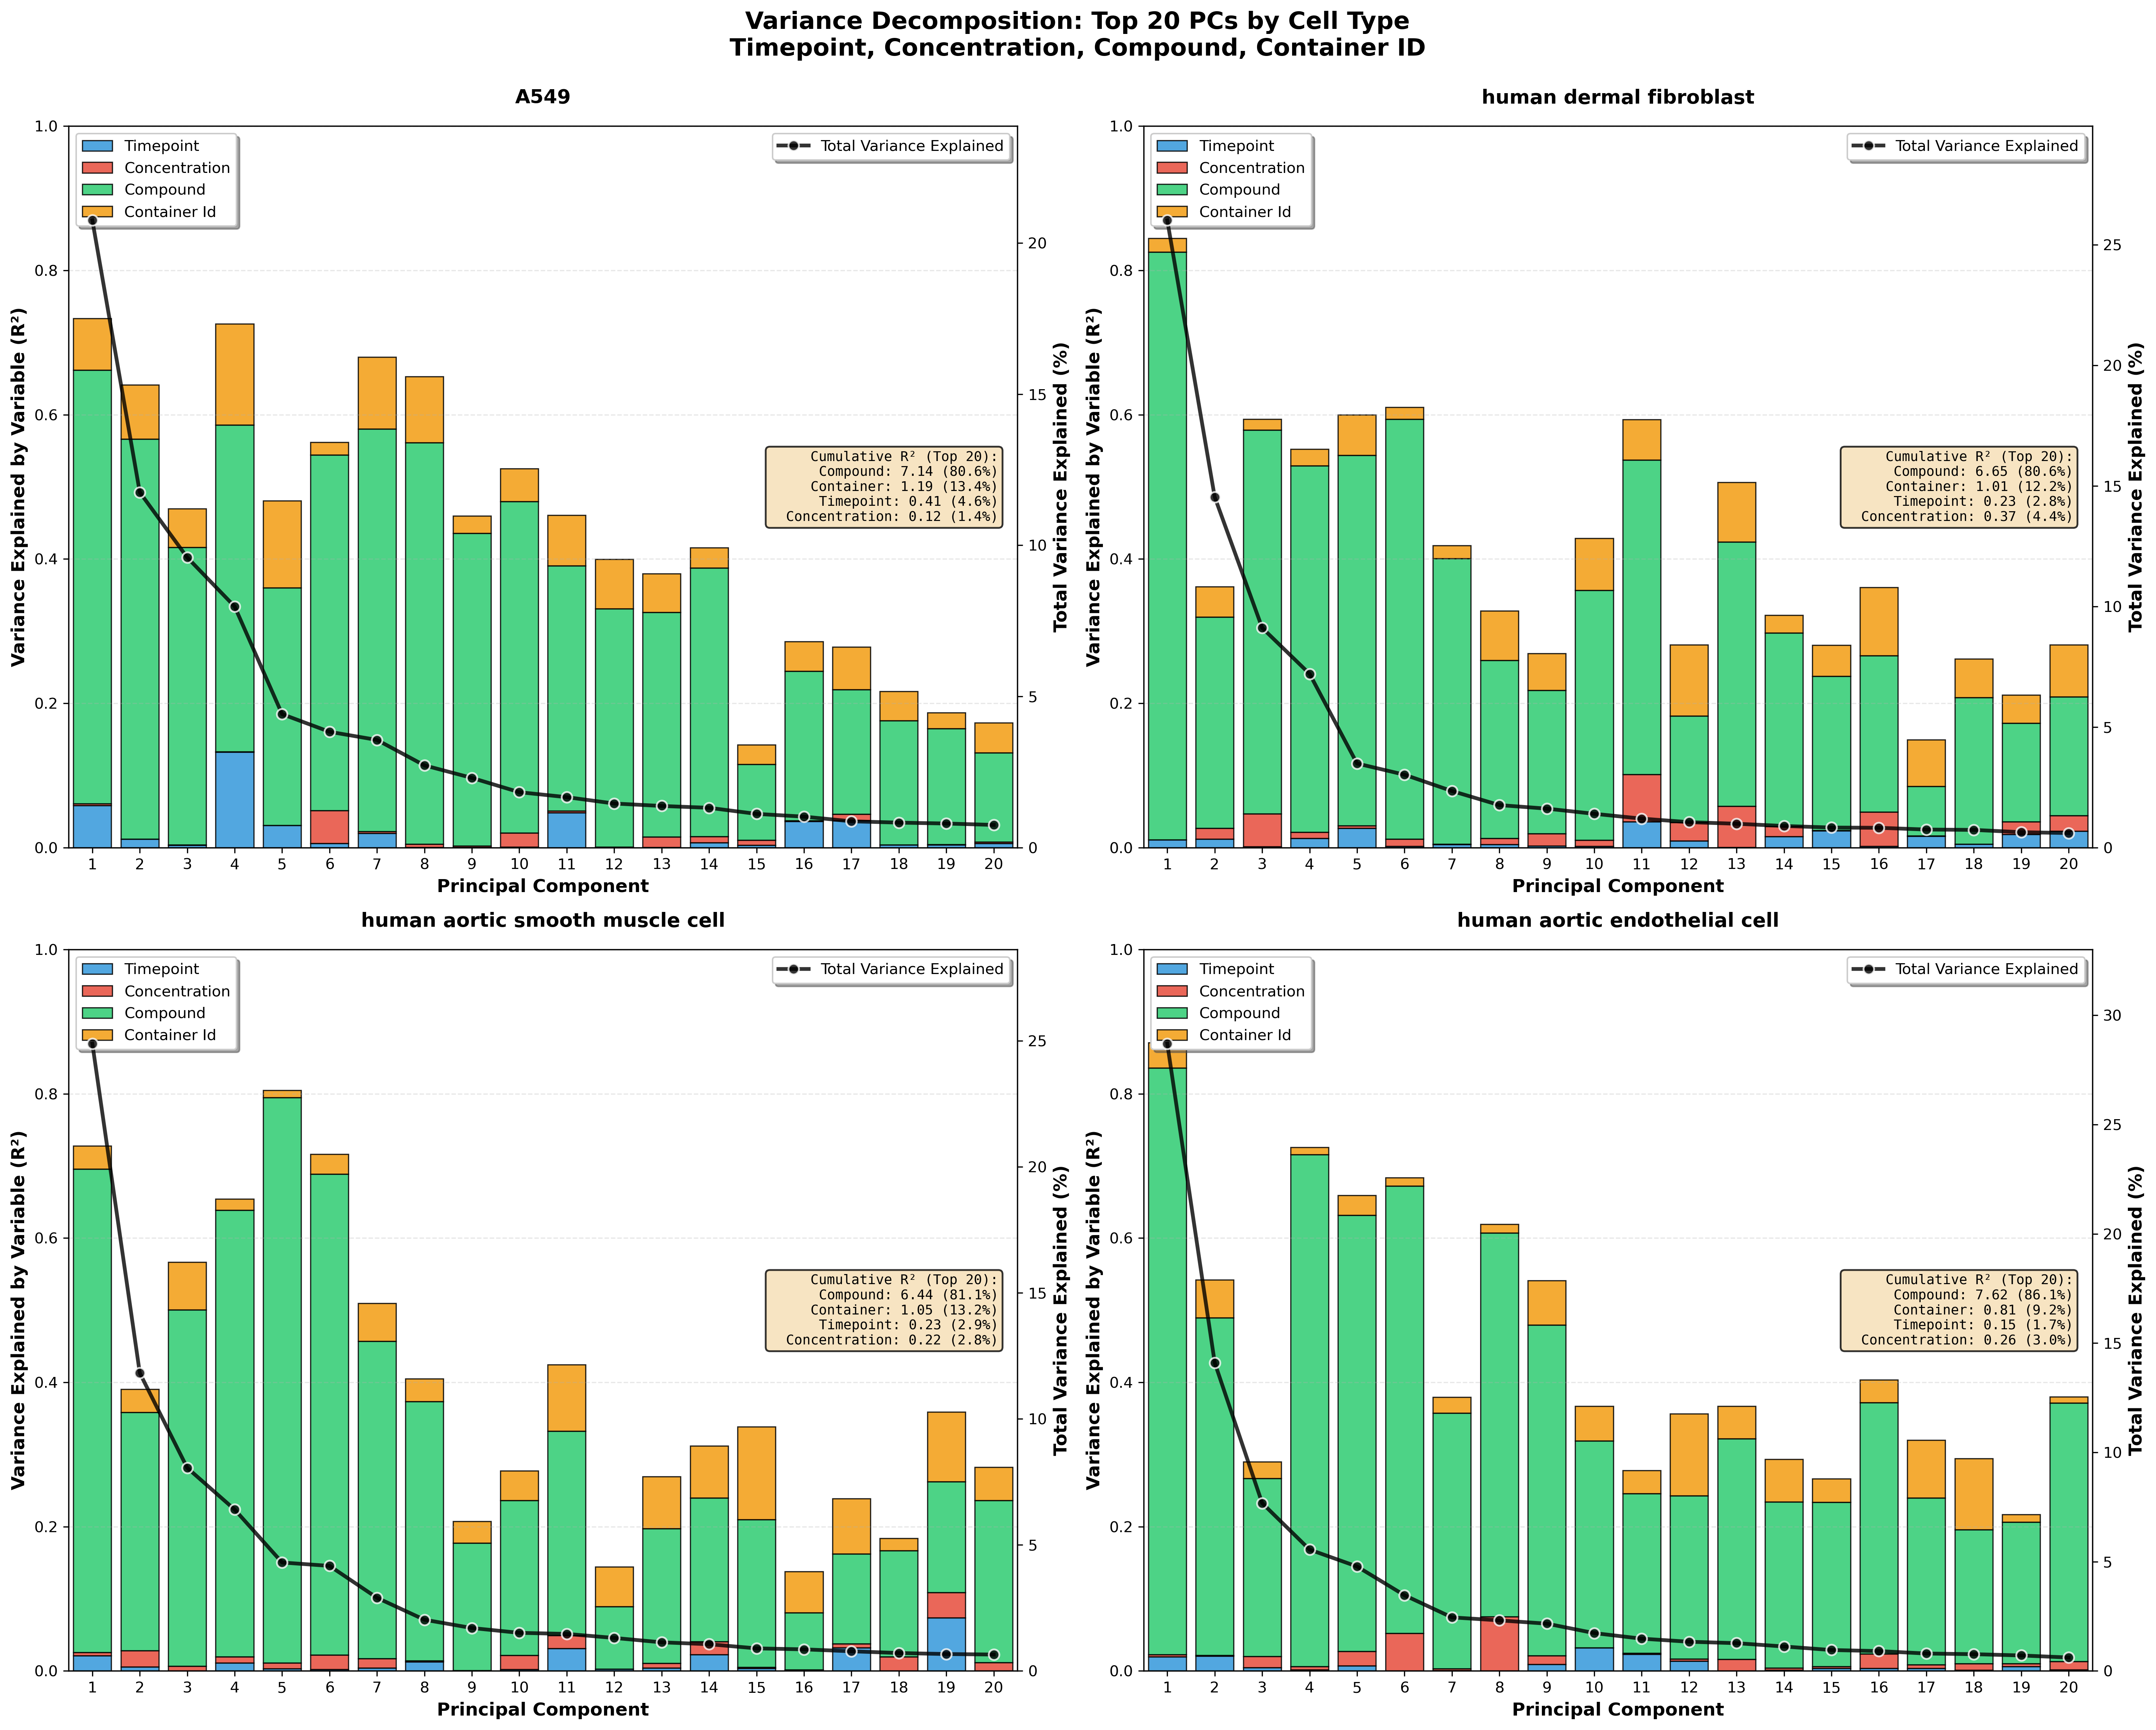
Figure 6: Top 20 PC’s for variance explained by timepoint, condition, concentration, compound, container_id, and location.
Biomni synthesized the Cell Painting results into a set of clear, comparative insights across cell types. Aortic Endothelial cells emerged as the most suitable for high-throughput screening, showing the greatest compound sensitivity while exhibiting the lowest batch effects. A549 cells were best suited for temporal studies, with responses that varied most strongly across time points. Dermal Fibroblasts showed the strongest sensitivity to compound concentration, making them particularly informative for dose–response analyses. In contrast, Aortic Smooth Muscle cells displayed a distinct principal component structure, with compound effects loading more strongly on PC5 rather than PC1, highlighting a unique morphological response profile compared with the other cell types.
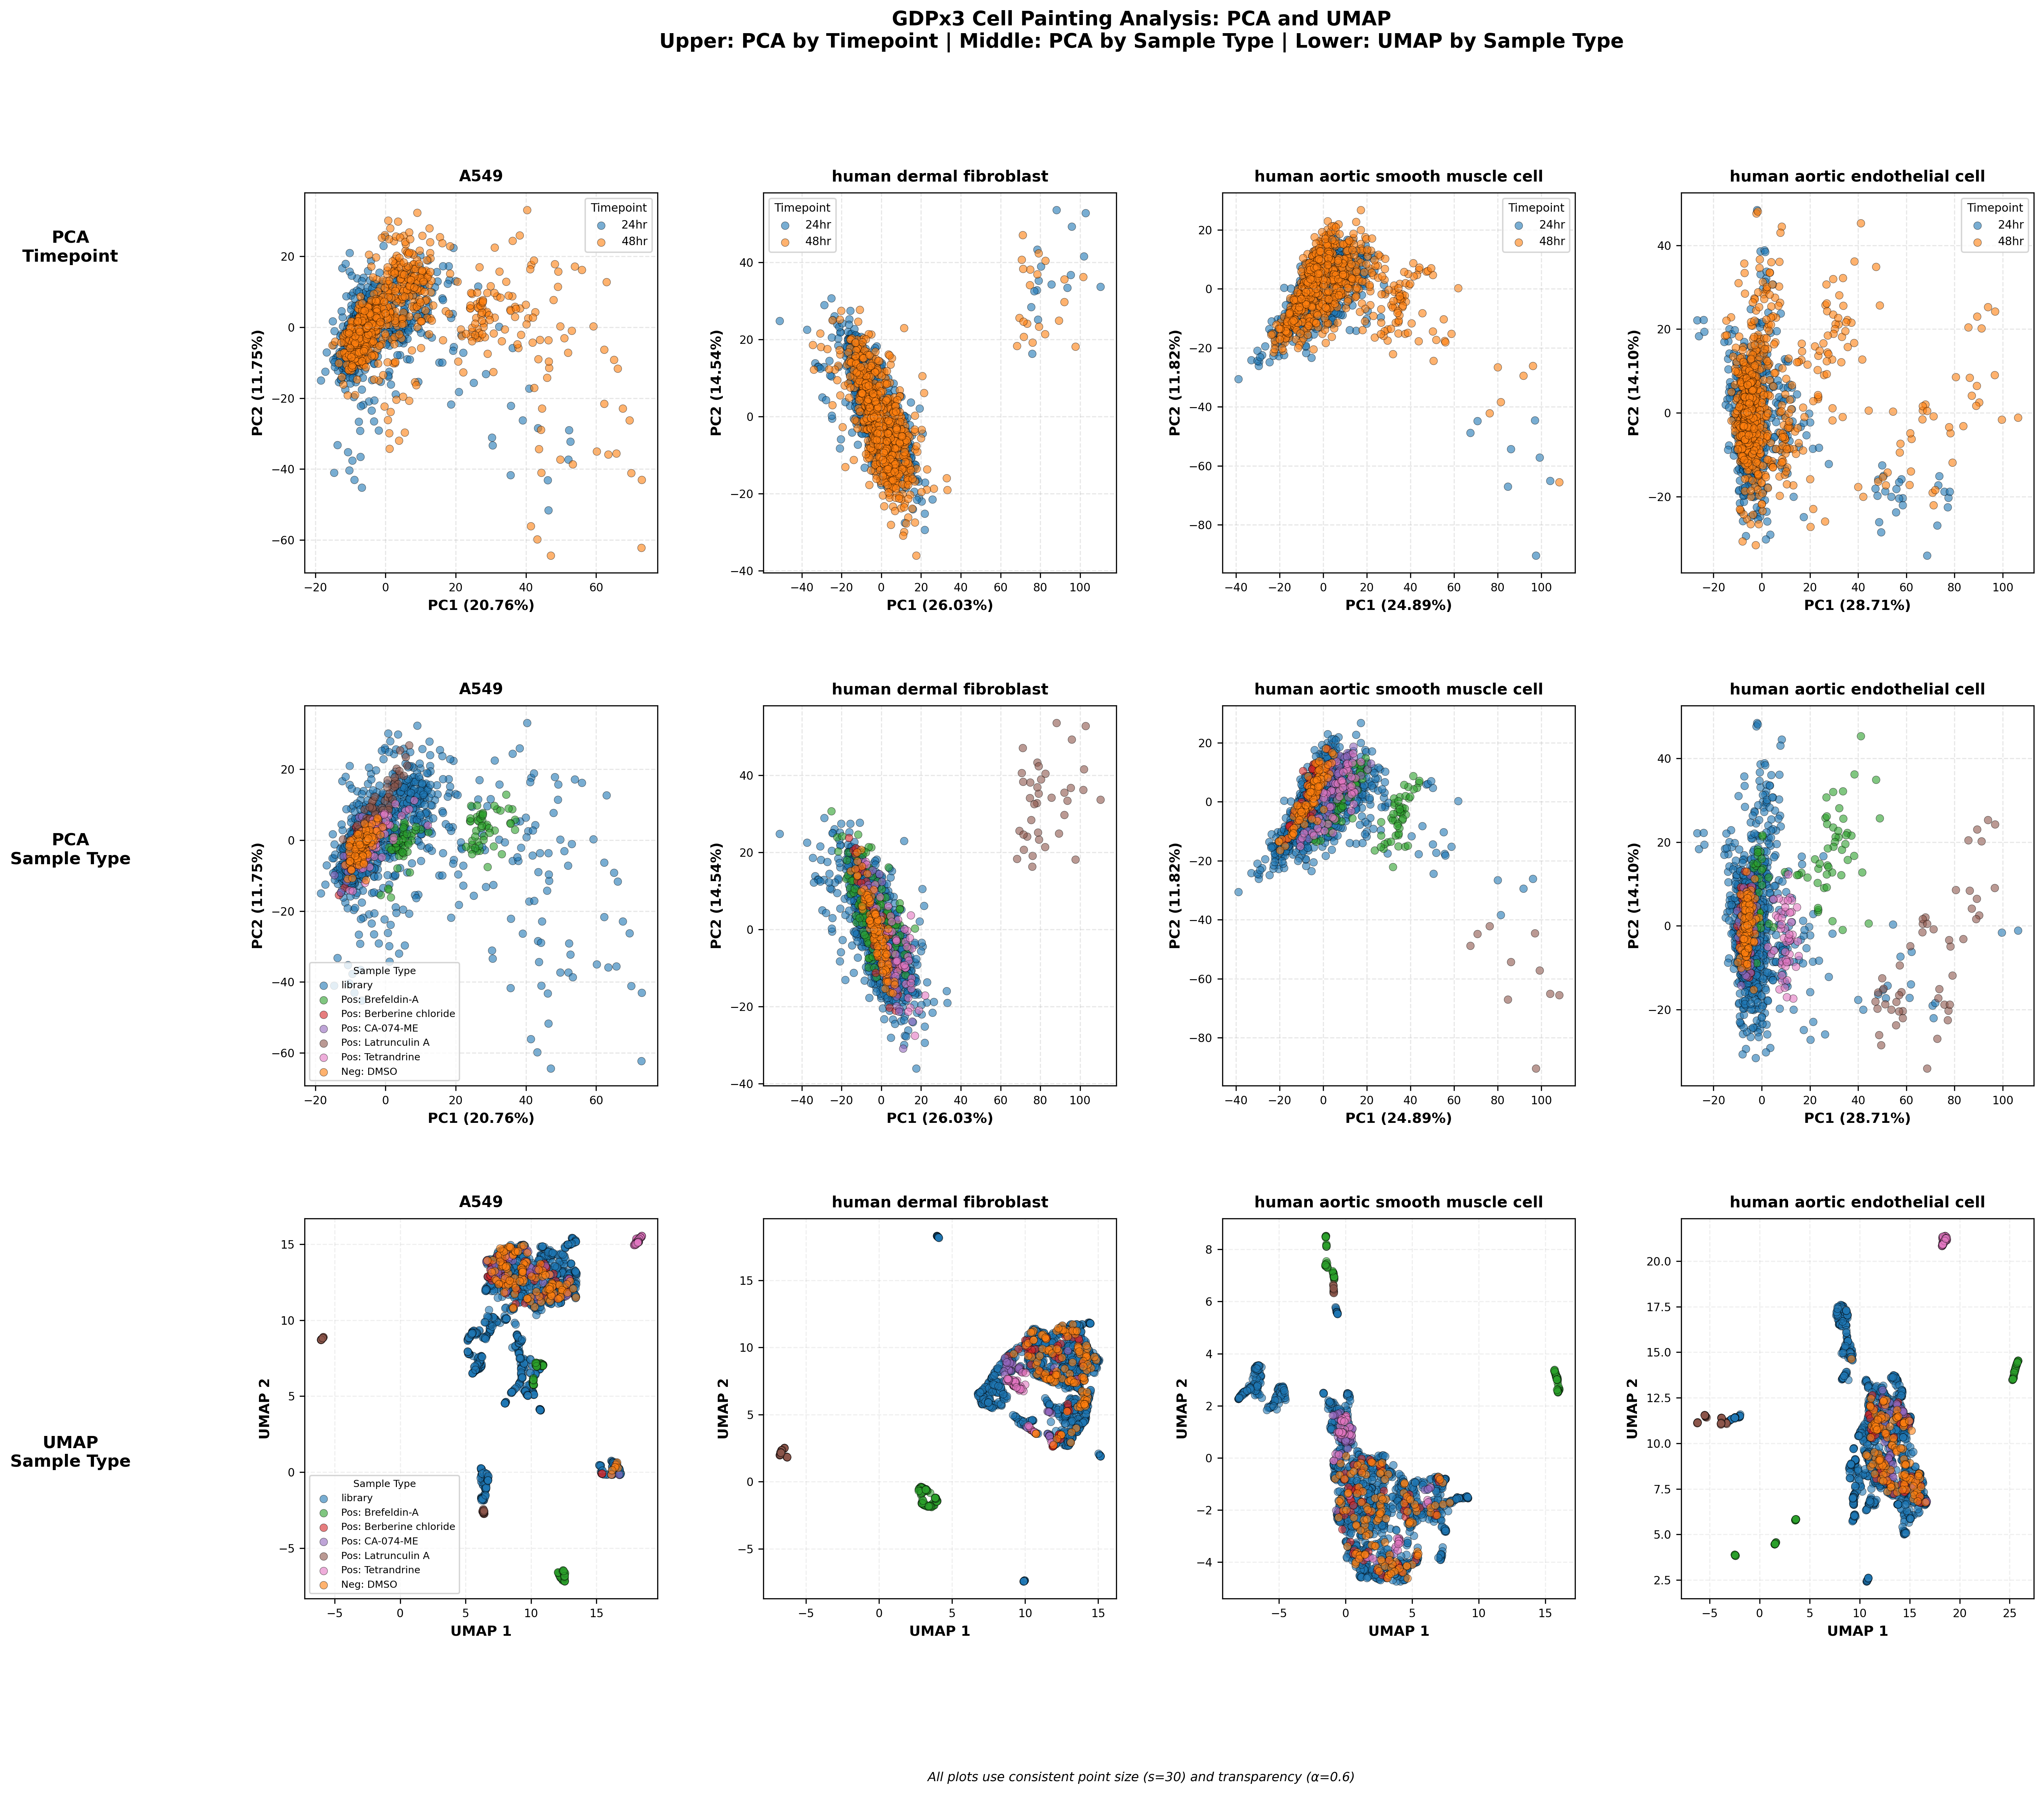
Figure 7: Features plot of PC1 vs PC2 colored by timepoints (24 and 48 hrs) at the top and colored by sample type in the middle plots. The bottom plots are UMAP visualizations using the top 20 PCs colored by sample type.
The PCA and UMAP projections were consistent with our expectations, with compound-driven effects accounting for the largest sources of variance in the morphological data. Among the tested compounds, latrunculin A and brefeldin A produced the most pronounced phenotypic shifts. Latrunculin A was broadly toxic across all concentrations and cell types, while brefeldin A induced a distinct and interpretable morphological signature, most notably affecting endoplasmic reticulum structure in a manner consistent with its known role in disrupting ER–Golgi trafficking.
Question 7: “For each cell type, using the z-scored GDPx3_median_selected.csv
values, calculate the percentage of compound treatment conditions whose calculated
replicate-to-replicate correlations are higher than the corresponding DMSO sample
replicate correlations. Generate a scatter plot with median pairwise spearman correlation
between replicate profiles on the x-axis and -log10(pvalues) on the y axis.”
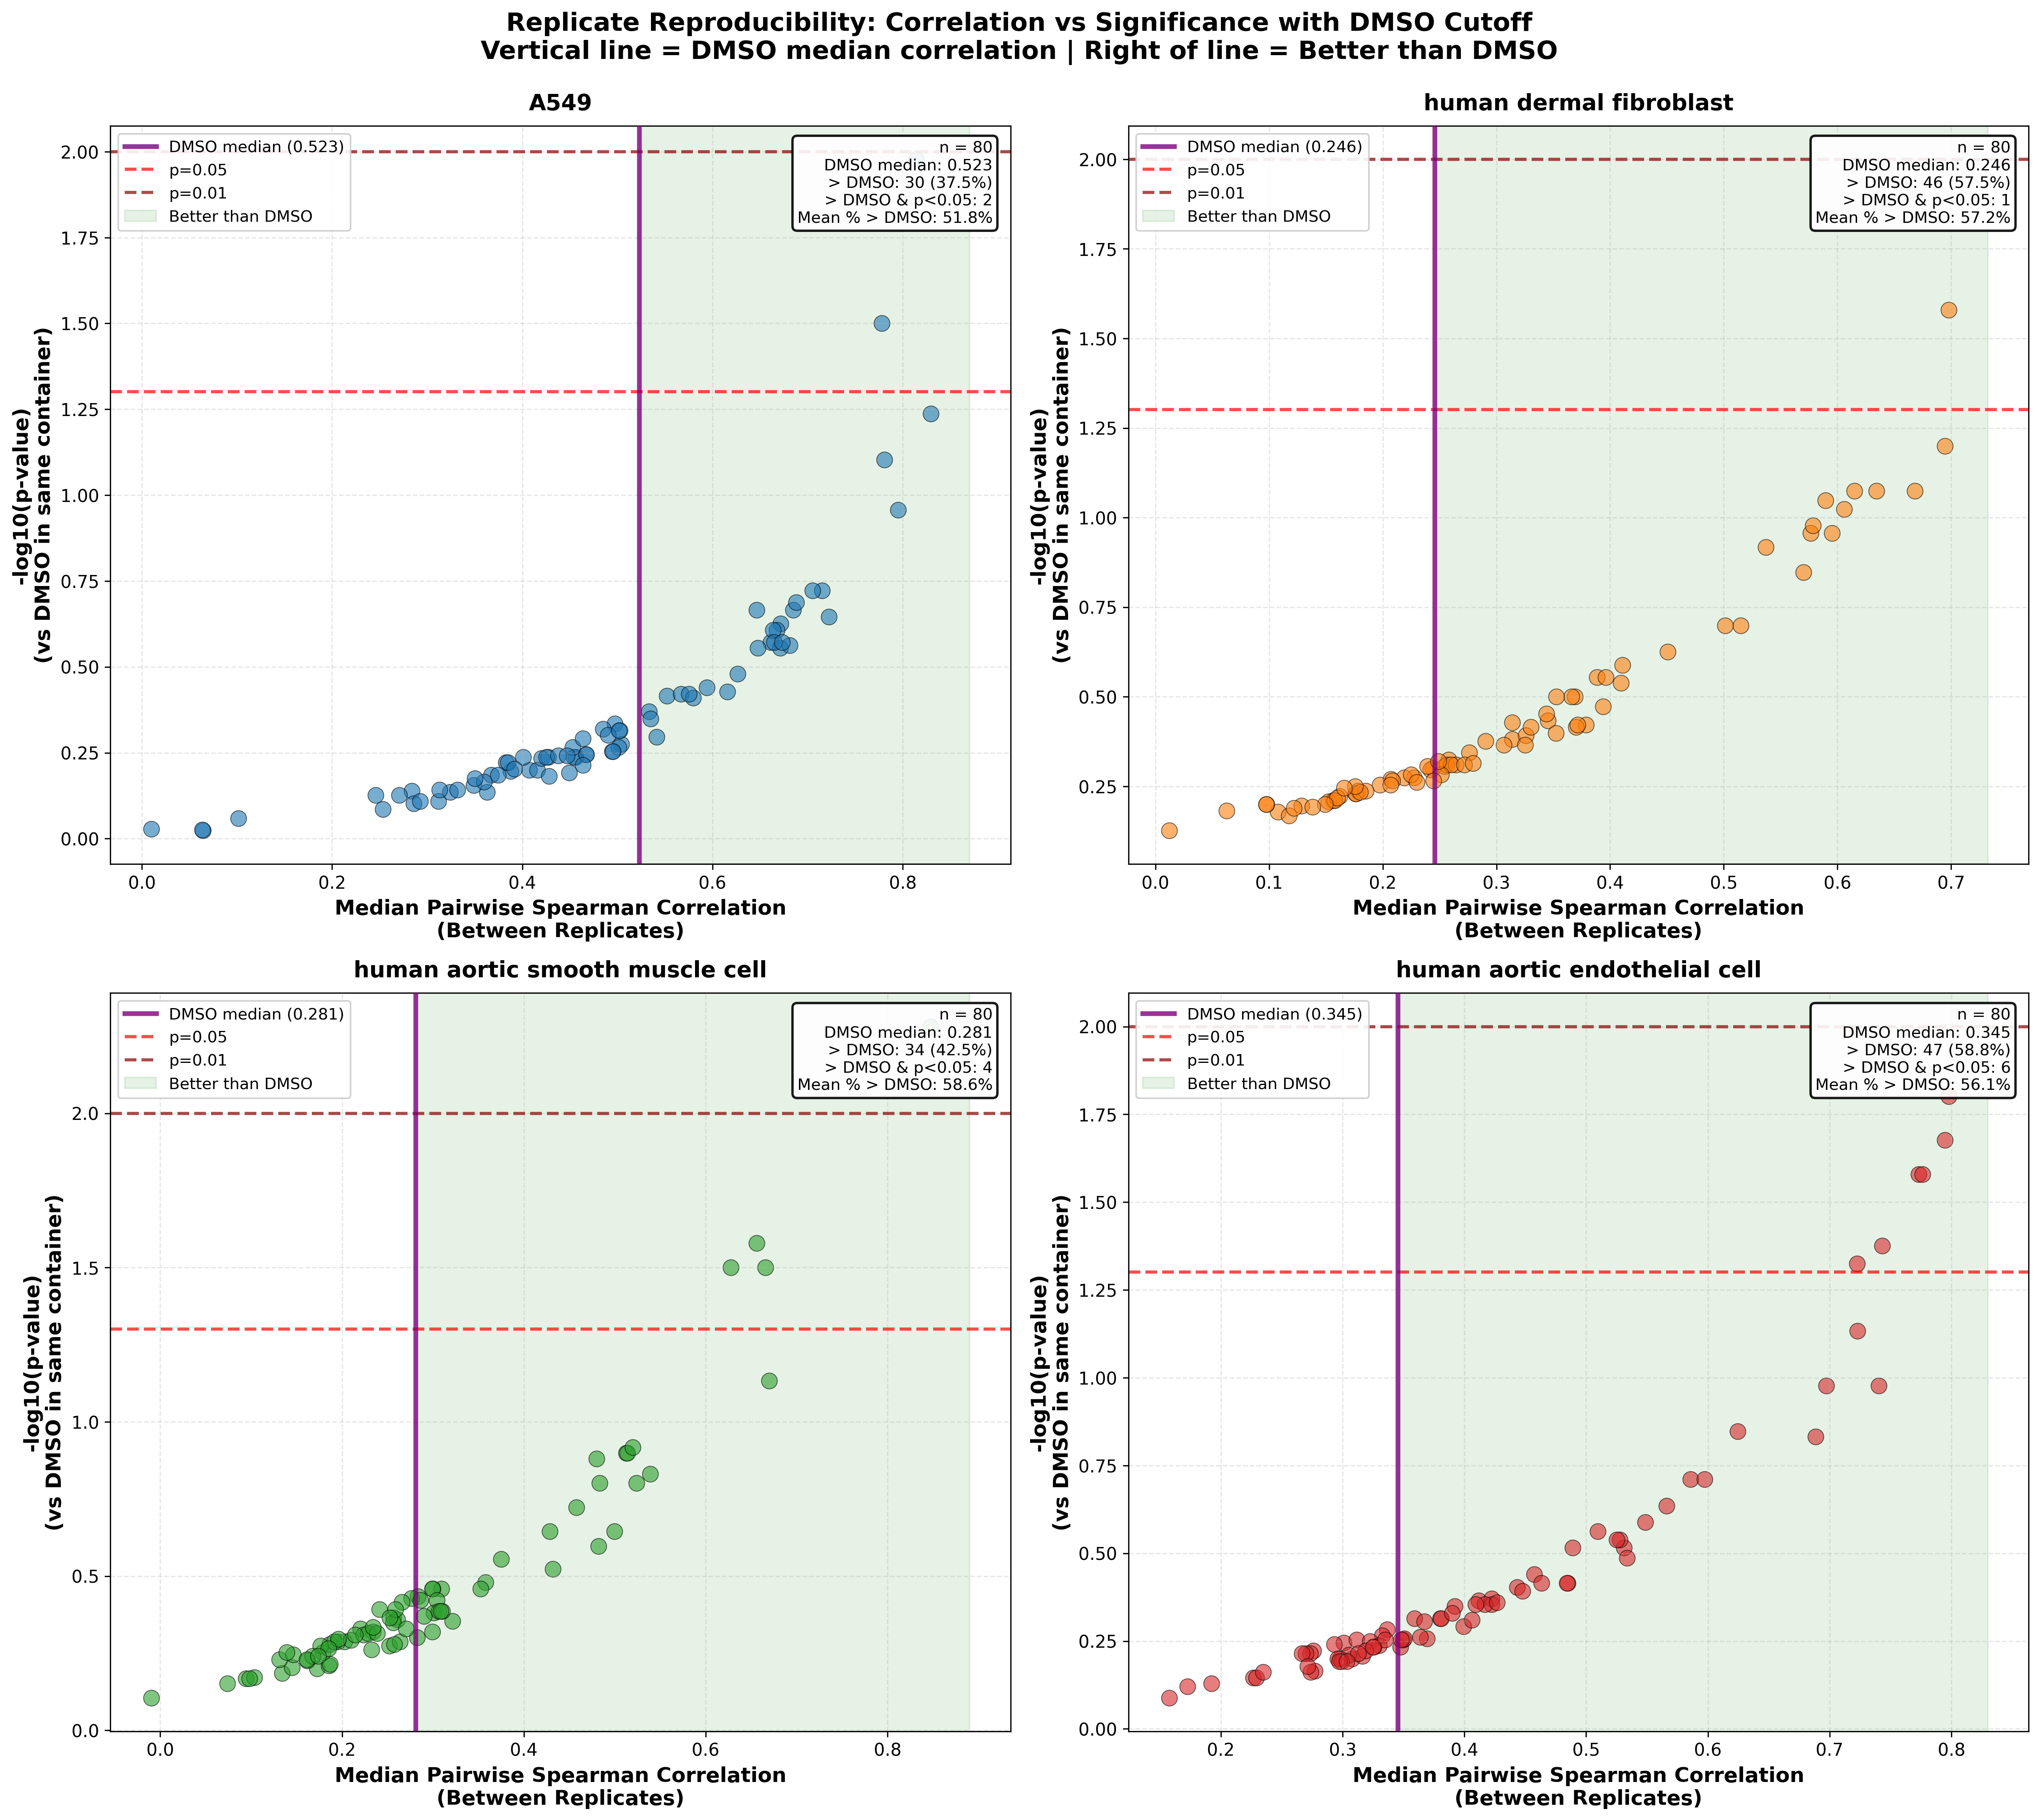
Figure 8: Percentage of profiles that correlate with each other more strongly than DMSO samples in the same container.
We observed significantly higher replicate correlation for DMSO-treated samples in A549 cells, whereas Dermal Fibroblasts showed the lowest DMSO correlations. Consistent with these baseline differences, Figure 8 highlights the compounds that outperform DMSO controls in each cell type, a pattern that is also supported by our internal analysis. Compounds located in the upper-right quadrant of the plot exhibit both the strongest pairwise correlations and the highest statistical significance relative to DMSO-treated samples within the corresponding cell types
The Bottom Line
The Ginkgo X Biomni collaboration demonstrates how AI can fundamentally expedite interpretation and visualization of large scale datasets. Remarkably, what took our team of 2 people several weeks to produce was completed by the agent in just a few hours. This represents a dramatic leap in productivity while arriving at comparable conclusions and publication-ready figures. The Biomni tools are intuitive and easy to use, providing clear visibility into each step of the analysis and the flexibility to adjust the plan of action as the workflow evolves By combining Ginkgo’s rich GDPx datasets with Biomni’s natural language-driven analysis capabilities, researchers can move from raw data to publication-ready insights. Together, we’re lowering the barrier to high-throughput data exploration and enabling scientists to uncover new biological hypotheses faster than ever before.
Experience It Yourself
Ready to explore? Visit https://biomni.phylo.bio/ and start asking questions about our GDPx datasets. You can explore these findings and generate your own hypotheses using natural language queries.
Ask questions like:
- “Using GDPx2_GSEA-HallmarkGenes.csv, which pathways are uniquely activated in different cell types and by which compounds?”
- "What cellular pathways are most affected by HDAC inhibitors in the GDPx2 datasets?"
- "Which compounds in GDPx3 have similar mechanisms of action?"
The AI will analyze the data, generate visualizations, and provide scientific insights through natural language queries.